- Published on
Sitecore Serialization CLI — improving performance via smarter configuration structure
- Authors

- Name
- Mark Gibbons
- @markgibbons25
I have been building a SitecoreAI solution that serves five sites (and counting) out of one content tree, plus a shared content branch the sites all draw from. For a long time I serialized the whole thing through a single Sitecore Content Serialization (SCS) module — one *.module.json with about 18 includes covering templates, renderings, settings, and site configuration items.
dotnet sitecore ser pull took around 30 seconds. push around the same. Every time, for any change, no matter how small. Too slow! Time to investigate!
Step 1: Split the module
After stewing on it for some time, I asked Claude to break the single module into one module per site, plus a common module for the shared project items (templates, layouts, renderings, workflows, the collection root, roles):
src/serialization/
  common/    common.module.json     (Common)
  shared/    shared.module.json      (Shared-site)
  site-a/    site-a.module.json      (SiteA-site)
  site-b/    site-b.module.json      (SiteB-site)
  site-c/    site-c.module.json      (SiteC-site)
  site-d/    site-d.module.json      (SiteD-site)
  site-e/    site-e.module.json      (SiteE-site)
  global/    global.module.json      (Global)
Claude then benchmarked it properly, rather than trusting a gut feel — five pulls and five pushes, averaged, against the old single-module layout checked out from git, hitting the same database both times:
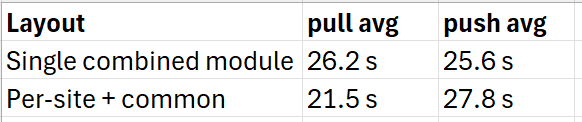
So pulls came down about 17% — a real, repeatable improvement, and not nothing. But push actually drifted the wrong way, and the run-to-run variance inside a single five-run set (pulls ranged 18.9–23.4 s) was nearly as wide as the gap between the two layouts. I’d gone in expecting the split to be transformative, and what I got was a modest trim on one half of the operation.
That mismatch is the interesting bit. If carving the tree into eight modules only buys 17% on pull and a slight regression on push, then the cost of these operations clearly isn’t dominated by how the items are grouped. So what is it dominated by?
Step 2: Turn on the trace flag
dotnet sitecore ser pull has a -t / --trace flag that prints "more additional diagnostic and performance data." Sounds good, so I let Claude at it. It's noisy — over 300 lines for my tree — but it breaks the operation into phases with timings, and that's exactly what I needed. Here's the whole pull, boiled down:
FSIndex:   Loaded filesystem indices in 1,980ms (4,517 metadatas)
SCIndex:   Loaded Sitecore subtrees in 20,587ms (34,100 metadatas)
Prefetched 38,617 nodes.
Discovered 0 changes after evaluating 4,517 total items.   (346ms)
Synced 1 trees in 21,109ms
Two numbers jumped out.
The first is where the time actually goes. Reading 4,517 files off disk (FSIndex) takes 2 seconds, and computing the diff takes a third of a second. Everything else — 97.5% of the wall clock — is SCIndex, fetching item metadata from the CM over GraphQL. The client and the filesystem aren't the bottleneck; the server round-trip is, by a mile.
The second number is the one that actually explained everything: 34,100 metadatas loaded, 38,617 nodes prefetched — to keep 4,517. I was pulling metadata for roughly 8.5× more items than I serialize, then throwing about 88% of it away. The per-request timings made it concrete — the slowest single GraphQL request took 18.4 seconds, and a handful of 17–18s requests gated the whole run.
And there’s the answer to why the split underwhelmed. Splitting items into modules doesn’t change how many nodes the server has to enumerate — it’s the same tree whichever way you slice the config. The 17% I got on pull was real, but it was a rounding error next to the thing I should have been attacking.
Step 3: Find the over-fetch
Where do 34,000 phantom nodes come from when you only serialize 4,500? A scoped pull made it obvious. Tracing a single site:
pull -i SiteA-site
  SCIndex:   3,730ms (8,336 metadatas)
  Prefetched 8,747 nodes.
  Discovered 0 changes after evaluating 411 total items.
That site serializes 411 items, and SCS enumerated 8,747 to find them — a 21× over-fetch on one site alone. What makes it especially galling is that the site serializes zero author pages: its Home is a SingleItem, and all the actual website content lives underneath Home.
The culprit was the predicate shape. Every site looked like this, and the shape isn’t something I invented — it comes straight from Sitecore’s own Accelerate Cookbook “template module.json” example, which is the de facto starting point for XM Cloud site serialization:
{
  "name": "SiteA",
  "path": "/sitecore/content/<tenant>/SiteA",
  "scope": "ItemAndDescendants",
  "rules": [
    { "path": "/Home",         "scope": "SingleItem" },
    { "path": "/Data",         "scope": "ItemAndChildren" },
    { "path": "/Presentation", "scope": "ItemAndDescendants" },
    { "path": "/Settings",     "scope": "ItemAndChildren" },
    { "path": "*",             "scope": "Ignored" }     // <-- the trap
  ]
}
The intent reads perfectly: take the whole subtree, but ignore everything except these named branches. The catch is when that *: Ignored rule gets applied. Because the root scope is ItemAndDescendants, SCS asks the server for the entire subtree — including every author-created page under /Home — and only then runs the rules client-side to decide what to keep. The ignore rule trims the output; it does nothing to trim the query. So on every single pull I was hauling each site's full page tree across the wire just to discard it on arrival.
I want to be fair to the Accelerate template here: it’s a sensible, readable default, and on a young site with a dozen pages this over-fetch is completely invisible. It only starts to hurt once /Home has quietly grown into thousands of author pages — which is exactly what happens to a site that's been live for a while.
Step 4: Root the includes below /Home
The fix is to stop rooting at the site node. Instead of one ItemAndDescendants include with a catch-all ignore, I use one include per first-level branch I actually serialize, and the branches I don't want simply never appear as includes:
"includes": [
  { "name": "SiteA",        "path": ".../SiteA",              "scope": "SingleItem" },
  { "name": "Home",         "path": ".../SiteA/Home",         "scope": "SingleItem" },
  { "name": "Media",        "path": ".../SiteA/Media",        "scope": "SingleItem" },
  { "name": "Data",         "path": ".../SiteA/Data",         "scope": "ItemAndChildren" },
  { "name": "Dictionary",   "path": ".../SiteA/Dictionary",   "scope": "ItemAndDescendants" },
  { "name": "Presentation", "path": ".../SiteA/Presentation", "scope": "ItemAndDescendants", "rules": [ ... ] },
  { "name": "Settings",     "path": ".../SiteA/Settings",     "scope": "ItemAndChildren",
      "rules": [ { "path": "/Site Grouping", "scope": "Ignored" },
                 { "path": "/Standard Values", "scope": "Ignored" } ] },
  { "name": "Settings-Site-Grouping",   "path": ".../Settings/Site Grouping",   "scope": "ItemAndDescendants" },
  { "name": "Settings-Standard-Values", "path": ".../Settings/Standard Values", "scope": "ItemAndDescendants" }
]
Now Home is a SingleItem include, so the server is never asked for its descendants. The page tree is never enumerated, because nothing roots above it with descendant scope.
Two things tripped me up along the way, worth passing on:
- A rule’s scope can’t exceed its include’s root scope. SCS rejects a config where, say, a
Settingsinclude scopedItemAndChildrenhas aStandard Valuesrule scopedItemAndDescendants. That's whySite GroupingandStandard Valuesended up as their own includes, withIgnoredrules in the parent so they aren't double-counted — and so the deepSettingsdescendants I never wanted (likeForm Submission Settings/*) stay excluded, exactly as before. - Include names map to folders on disk. Splitting one include into nine relocates the serialized
.ymlfiles into per-branch folders. It's a one-time churn in the repo, and it's unavoidable if you want the speedup — the rules run after the query, so there's no server-side "exclude this subtree" you can bolt onto the old shape.
The results
Here’s the same trace after the change:
pull -i SiteA-site
  SCIndex:   839ms
  Prefetched 411 nodes.          (was 8,747)
  Discovered 0 changes after evaluating 411 total items.
Exactly 411 nodes fetched for 411 items kept — zero over-fetch. And crucially, the serialized output is the same set down to the item: Claude verified every module by diffing the item paths before and after the change.
site-a:  IDENTICAL ✓ (411 items)
site-b:  IDENTICAL ✓ (314 items)
site-c:  IDENTICAL ✓ (270 items)
site-d:  IDENTICAL ✓ (427 items)
site-e:  IDENTICAL ✓ (428 items)
shared:  IDENTICAL ✓ (709 items)
Across the whole tree, SCIndex dropped from 34,100 metadatas to 4,517 — a 7.5× reduction in server work. The full pull came down from ~21 s to ~12 s (still bouncy, because the CM/SQL container's GraphQL latency is the floor now). And additionally, a real day-to-day payoff for scoped operations:

Lessons
A few things I took away from this one:
- The module split wasn’t wrong, just not enough. It bought a modest 17% on pull and, more importantly, it’s what makes scoped operations possible — and that’s where the real savings turned out to live. But grouping alone can’t fix a predicate that over-queries, because it doesn’t change what the server has to enumerate.
-tto validate. I wasted time on a benchmark cycle proving a hypothesis the trace would have settled in a single run.ItemAndDescendants+*: Ignoredis a quiet performance trap. It's a lovely way to express what to keep and a terrible way to express what to fetch. If the branch you're ignoring is a big author content tree, you pay full freight for it on every sync. Root your includes at the branches you actually serialize.- Optimise the layer that’s actually slow. 97.5% of my time was one GraphQL phase. The filesystem, the diff, the number of modules — none of it mattered, and the trace told me so before I’d written a line of new config.